a/b Testing is a crucial part of business. Continuous improvements are how you evolve and learn about your users (always be testing). Over the years I have formulated the correct balance of Art and Science to get positive results for tests. Averaging over 400 tests a year, I can say having a process and methodology in place is important for success.
Success to me is defined as learning from winning tests and losing tests. Even if you fail and do not validate a test with a positive result, you’re still learning about users and behavior. I build (2) different variations of tests (incremental and rapid redesign tests) on (2) types of platforms:
Depending on sample size, Level of Confidence and Relative Difference I can see positive or negative results within a working week. But sometimes it can take much longer to validate.
Here are a few of my recent success over the past year.
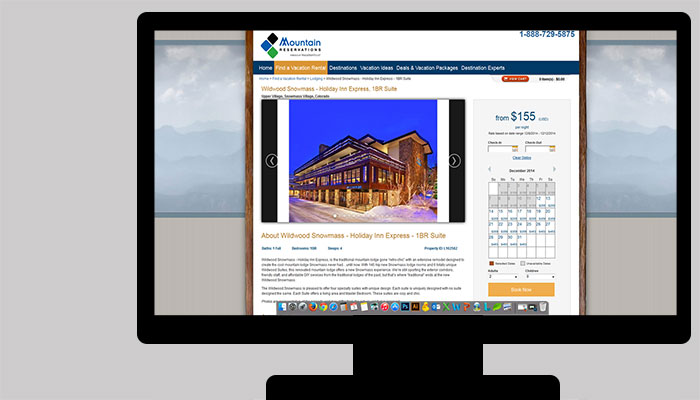
I recently validated the above test on the travel site Property Detail Page. I was able to improve click through rate on all device types by 15%.
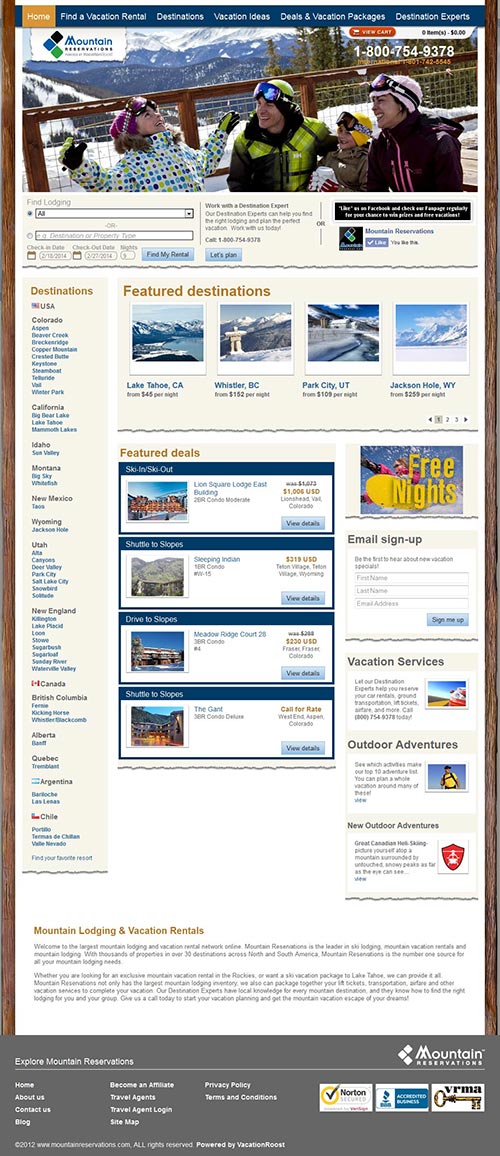
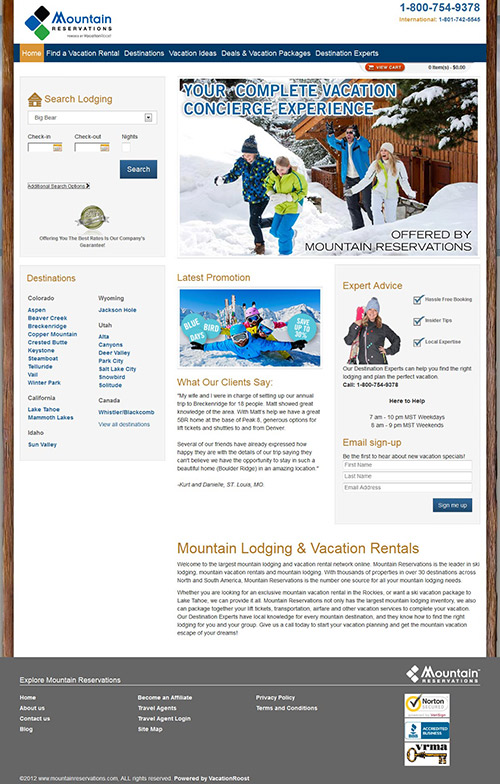
Hypothesis: a user will be more inclined to engage and search a homepage rather than bounce with a clean, responsive layout.
Problem Statement: under the hood, this site ran cluttered HTML5 / CSS, while above offered poor call to actions and little value proposition to a user why they should continue searching the homepage.
Synopsis: I lead the Google Analytics analysis, wire-frame execution and testing protocol. The updated homepage and site are operated with .NET and a Bootstrap 3.0 framework.
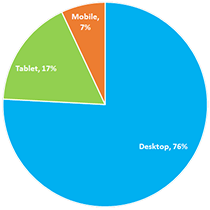
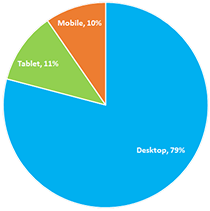
Annual Sessions for 2014, based upon device types.
| Success Metric | Control | Test | Gain |
|---|---|---|---|
| Bounce Rate | 50.21% | 32.44% | 35.39% |
| Click Through | 25.30% | 37.63% | 48.73% |
| Page Load | 8.83% | 3.50% | 60.36% |
Control Group
Test Group
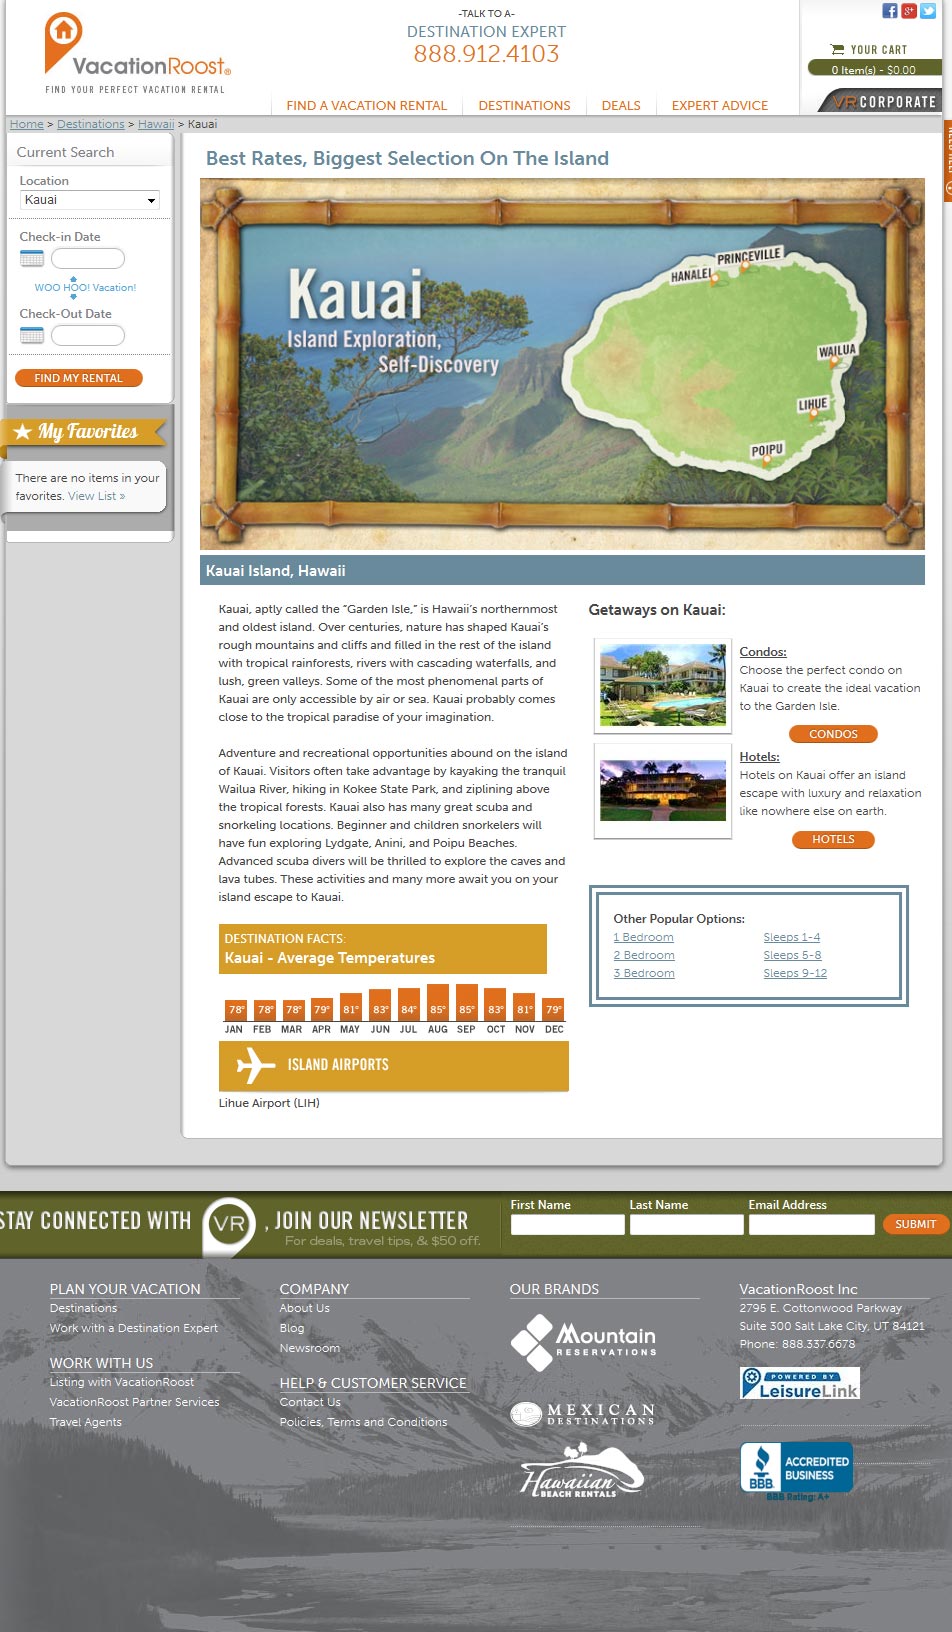
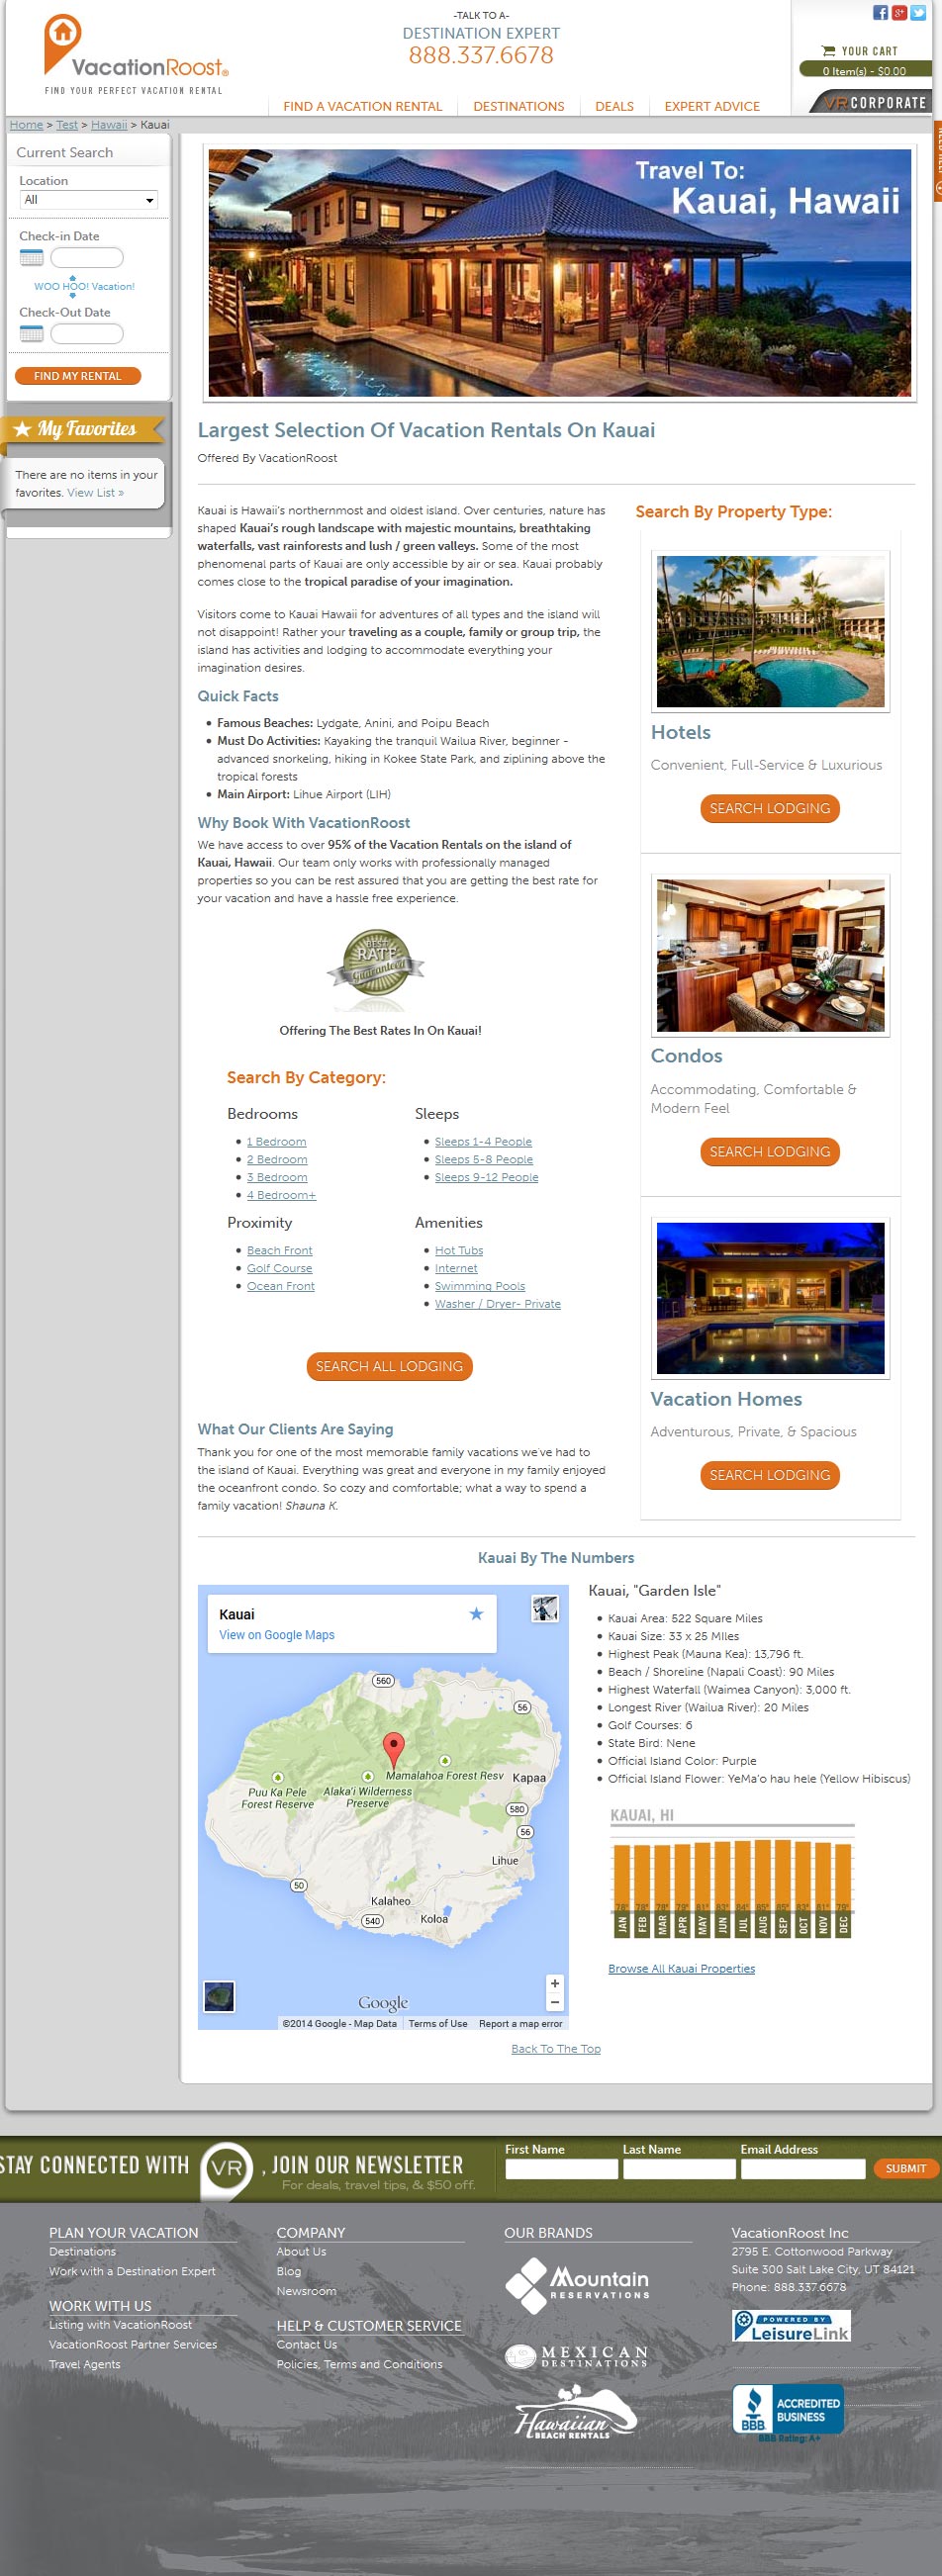
Hypothesis: optimizing the layout to show brand authority, value proposition of the product and offer additional information on a destination, the user will be more inclined to search.
Problem Statement: the page was not optimized for quick scanning, offered little value proposition and few available ways to search.
Synopsis: I lead the Google Analytics analysis, wire-frame and implementation of this test. After validation, I carried this framework over to 25 other PPC Landing Pages
Annual Sessions for 2014, based upon device types.
| Success Metric | Control | Test | Gain |
|---|---|---|---|
| Bounce Rate | 61.82% | 31.03% | 49.81% |
| Page Engagement | 75.35% | 88.12% | 16.95% |
| Click Through | 47.01% | 55.57% | 48.73% |
Control Group
Test Group
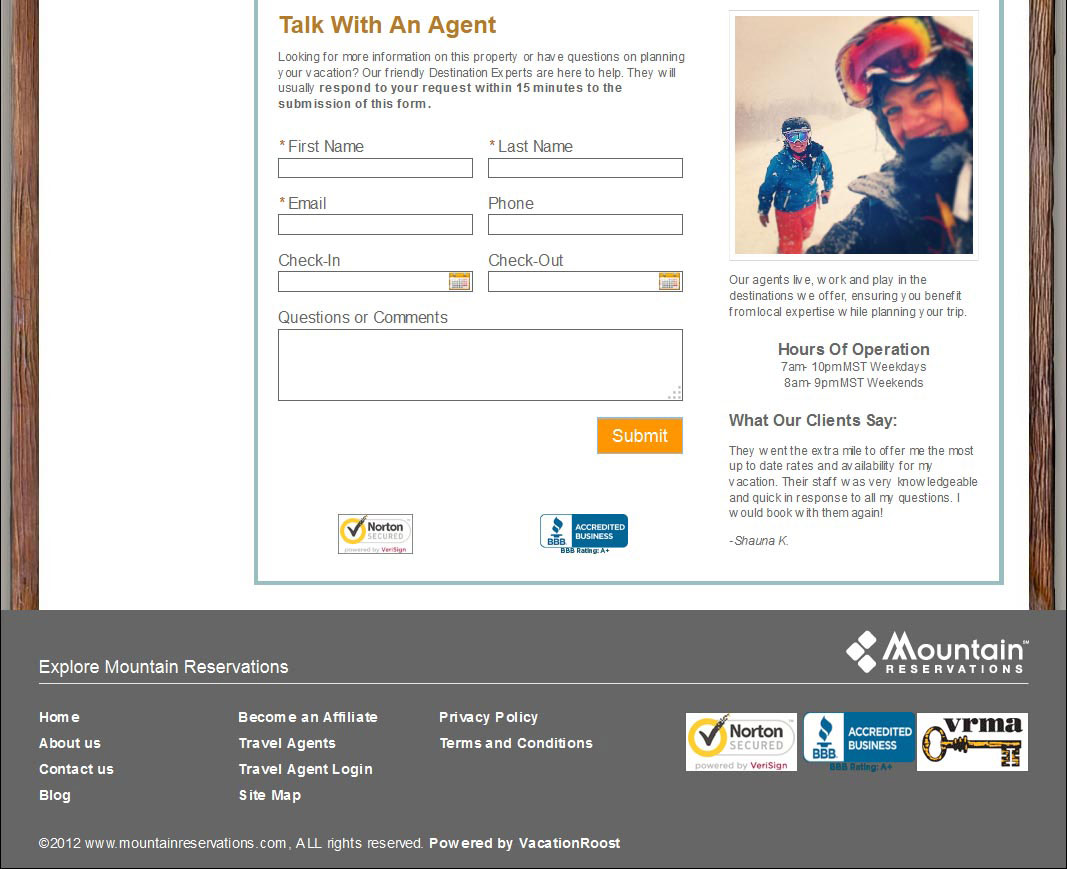
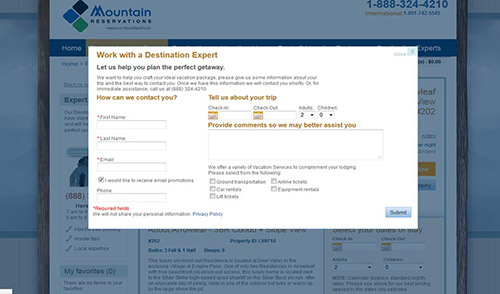
Hypothesis: by improving user expectations, reducing friction and anxiety, users will be more inclined to fill out the form and submit.
Problem Statement: the form offered little personality of how the company could really solve customer inquires. This along with a clunky layout, no value proposition or customer testimonial made the form a failure.
Synopsis: I managed the Google Analytics analysis, preformed UX research on previous submission to gain connection, wire-frame execution and test protocol. For 2014, the ROI on this optimization has succeeded expectations. It's operational on 55 travel websites and communicates via web service to an internal sales system.
Annual Sessions for 2014, based upon device types.

| Success Metric | Control | Test | Gain |
|---|---|---|---|
| Bounce Rate | 18.92% | 14.92% | 21.14% |
| Lead Submission | 0.73% | 0.85% | 16.80% |
| Comment Submissions | 15.25% | 22.00% | 44.26% |
Control Group
Test Group
